Autoscaling
Back to home
On this page
Autoscaling is a feature that automatically adjusts how many instances of your application are running, increasing capacity when demand rises, and reducing it when things are quiet. It helps your app stay responsive under heavy load while keeping your infrastructure costs efficient.
What is autoscaling? 
Autoscaling works through horizontal scaling, by adding or removing whole application instances depending on resource usage. If CPU or memory utilization stays above a certain threshold for a set time, Upsun automatically adds more instances. If it stays low, Upsun removes unneeded ones. You control these thresholds and limits, so scaling always happens safely and predictably.
- Scope: Available for applications only
- Product tiers: Available for all Upsun Flex environments
- Environments: Configurable per environment - across development, staging, and production
Know your app first
Autoscaling is quick to set up: you can enable it in a few clicks from your environment’s Configure resources tab. However, it’s important to understand your app’s typical performance before turning it on.
Tools like Blackfire can help you identify where your app consumes CPU or memory, so you can set realistic thresholds that reflect your traffic patterns. Blackfire can also help you spot whether autoscaling is likely to benefit your app or if a fixed setup with tuned vertical resources like CPU/RAM would serve you better.
When to use autoscaling
Autoscaling makes the most sense for workloads with variable or unpredictable traffic. It’s especially valuable when:
- You run time-sensitive or customer-facing applications where latency matters.
- Your app experiences seasonal or campaign-driven spikes.
- You want to avoid paying for idle capacity during quieter periods.
Example: When autoscaling works effectively
A retail app sees traffic jump fivefold every Friday evening and during holiday campaigns. By enabling autoscaling, the app automatically adds instances when CPU usage rises and scales back overnight, ensuring smooth checkouts without wasted cost.
Example: When autoscaling might not be needed
An internal dashboard with predictable, low usage may not benefit from autoscaling. In this case, a fixed number of instances and tuned vertical resources (CPU/RAM) can be more cost-effective and stable.
Scale databases and resources
To vertically scale CPU, RAM, or disk, or horizontally scale applications and workers (manually), see:
Autoscaling availability
The tables below outline where autoscaling and manual scaling are supported, so you can plan your deployments with the right balance of flexibility and control.
Component support
| Component | Horizontal autoscaling | Manual scaling (Vertical) |
|---|---|---|
| Applications (PHP, Node.js, etc.) | Available | Available |
| Services (MySQL, Redis, etc.) | Unavailable | Available |
| Queues (workers, background jobs) | Unavailable | Available |
Product tier support
| Product tier | Horizontal autoscaling | Manual scaling (Vertical) |
|---|---|---|
| Upsun Flex | Available | Available |
| Upsun Fixed | Unavailable | Available |
Environment support
| Environment | Horizontal Autoscaling | Manual scaling (Vertical) |
|---|---|---|
| Development | Available | Available |
| Staging | Available | Available |
| Production | Available | Available |
Scaling trigger support
| Trigger | Console |
|---|---|
| Average CPU (min/max) | Available |
| Average Memory (min/max) | Available |
How autoscaling works
Thresholds
Autoscaling monitors the average CPU and memory usage of your running app instances.
You define thresholds that determine when new instances are launched or removed.
There are two different thresholds that your CPU and memory utilization operate within: A scale-up threshold and a scale-down threshold.
-
Scale-up threshold: If your chosen trigger (e.g. CPU usage) stays above this level for the time period you’ve set (the evaluation period), autoscaling will launch additional instances to share the load.
-
Scale-down threshold: If your chosen trigger stays below this level for the time period you’ve set, autoscaling will remove unneeded instances to save resources and costs.
To prevent unnecessary back-and-forth, autoscaling also uses a cooldown window: a short waiting period before another scaling action can be triggered. This can also be configured or kept to the default waiting period before any additional scaling starts.
Combined triggers
If both CPU and memory triggers are enabled, either one can initiate scaling. A global cooldown applies after each scaling event, but in rare cases, combined triggers may interact unexpectedly. For example, CPU scaling up followed by memory scaling down. Adjust thresholds and cooldowns carefully to avoid oscillation.
Default settings
Autoscaling continuously monitors the configured trigger across your app’s running instances. We will use the average CPU utilization trigger as the primary example for the default settings and examples below.
-
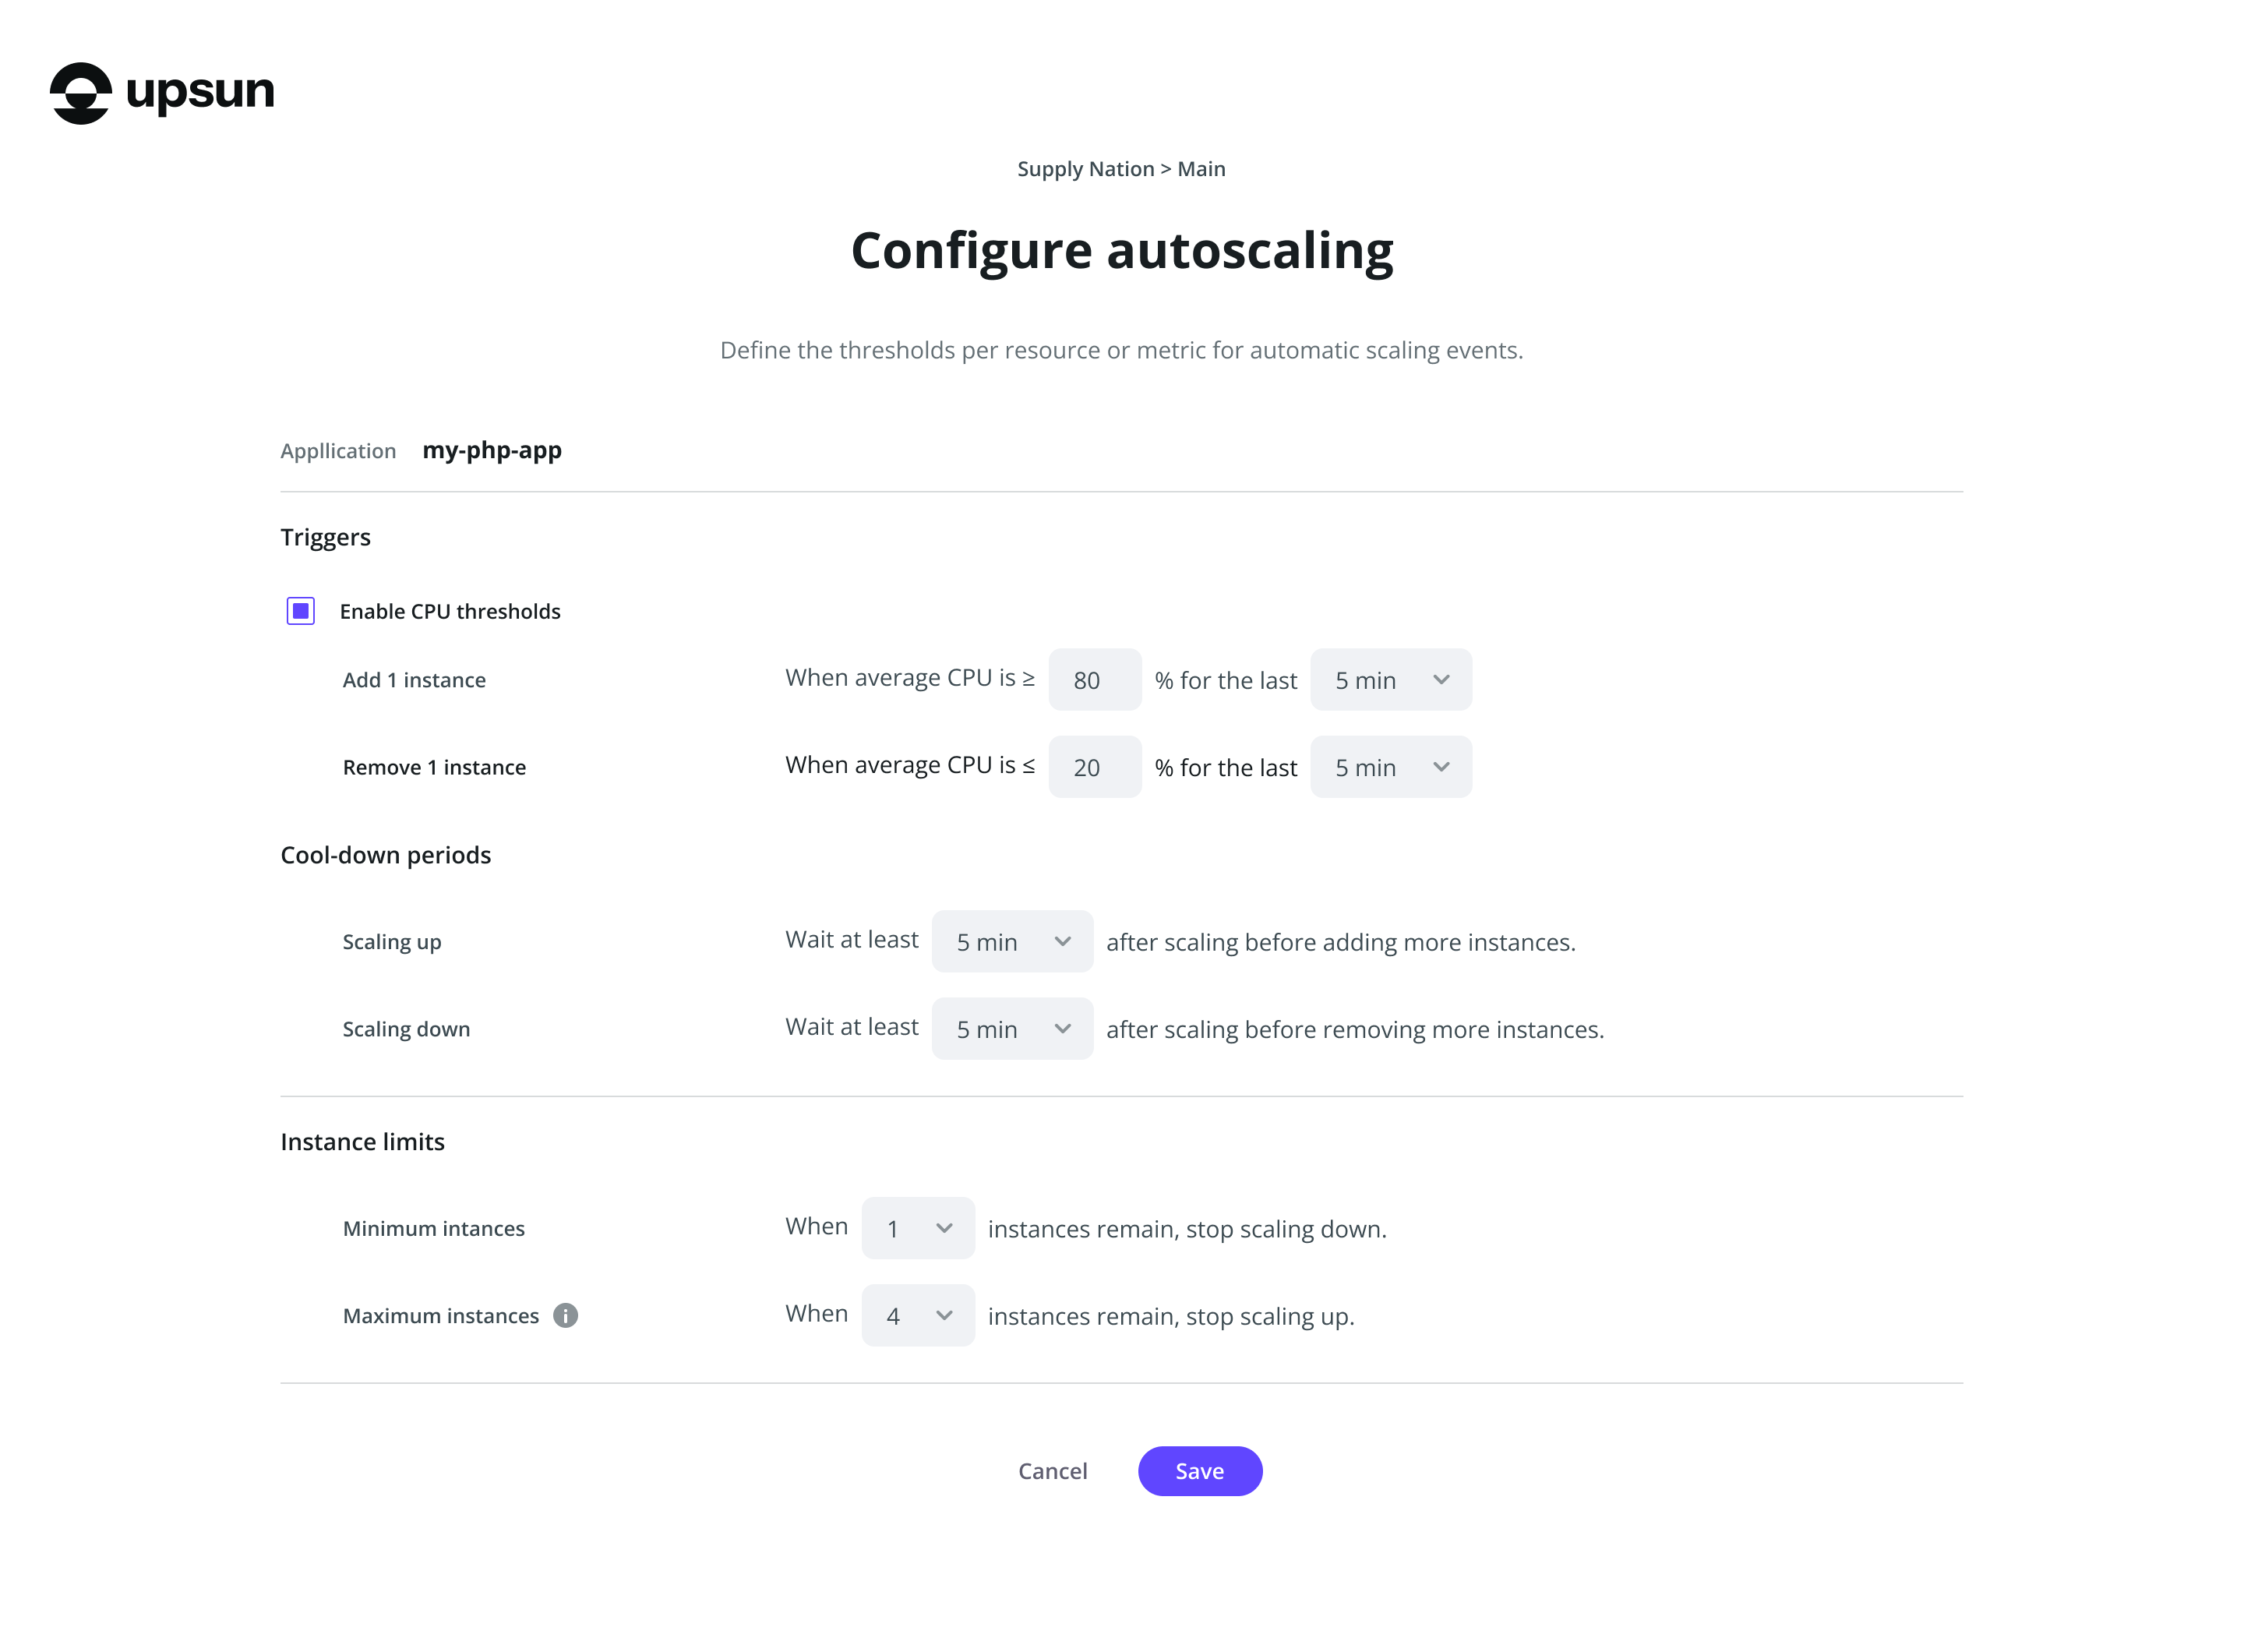
Scale-up threshold: 80% CPU for 5 minutes
-
Scale-down threshold: 20% CPU for 5 minutes
-
Cooldown window: 5 minutes between scaling actions
-
Instance limits: 1–8 per environment (region-dependent)
Instance limits and counts
- Default instance limits are typically 1–8 instances per environment, but the exact values depend on the region. Some regions may have higher or lower defaults. The scaling settings in your project always reflect the limits for the region where it runs.
- When autoscaling is enabled, manual instance count changes to apps are disabled. Vertical resources (CPU/RAM/disk per instance) remain configurable.
- To understand how an application’s instances are distributed, you can view the
instance details in the project’s
/run/peers.jsonfile. To learn more, see View application instance details in the “Resource configuration” topic.
Default behaviour (CPU example)
- If CPU stays at 80% or higher for 5 minutes, autoscaling adds an instance.
- If CPU stays at 20% or lower for 5 minutes, autoscaling removes an instance.
- After a scaling action, autoscaling waits 5 minutes before making another change.
This cycle ensures your app automatically scales up during high demand and scales down when demand drops, helping balance performance with cost efficiency.
Memory-based autoscaling
Autoscaling primarily relies on CPU utilization as its trigger, however you can also configure memory-based autoscaling, which works in a similar way, but with a few important differences to understand.
CPU-based triggers
CPU-based autoscaling reacts to sustained changes in average CPU utilization.
- Scale-up threshold: When average CPU usage stays above your defined limit for the evaluation period, instances are added to distribute the load.
- Scale-down threshold: When CPU usage remains below your lower limit for the evaluation period, instances are removed to save resources.
- Cooldown window: A delay (default: 5 minutes) before another scaling action can occur.
Memory-based triggers
Memory-based autoscaling follows the same principle as CPU triggers but measures average memory utilization instead. When your app consistently uses more memory than your upper threshold, Upsun adds instances; when memory usage remains low, it removes them.
This option is useful for workloads where caching or in-memory data handling determine performance - for example, large data processing apps or services with persistent caching layers.
Example
| Condition | Scaling action |
|---|---|
| Memory above 80% for 5 minutes | Scale up: Add one instance |
| Memory below 30% for 5 minutes | Scale down: Remove one instance |
Understand your app’s memory profile
High memory usage doesn’t always mean your app needs more instances. Linux systems use available memory for caching and buffering, so 90–100% usage can be normal even under stable conditions. Before using memory-based autoscaling, profile your application’s typical memory behavior to avoid unnecessary scaling and extra cost.
Tools such as Blackfire or system-level metrics in your Application metrics dashboard can help you understand what “normal” looks like for your app.
Configure memory triggers
- Open your project in the Console.
- Select your target environment.
- Choose Configure resources.
- Under Autoscaling, select Enable (if not already enabled).
- Choose Memory usage (min/max) as your scaling trigger.
- Set scale-up and scale-down thresholds, evaluation period, and cooldown window.
- Save changes — your app will now automatically scale based on memory utilization.
Guardrails and evaluation
Autoscaling gives you control over the minimum and maximum number of instances your app can run. These guardrails ensure your app never scales up or down too far. Set boundaries to keep scaling safe, predictable, and cost-efficient:
For example, you might configure:
- Minimum instances — Ensures a minimum number of instances of the configured application are always running (e.g.
2) - Maximum instances — Prevents runaway scaling (e.g.
8) - Evaluation period — Time CPU must stay above or below a threshold before action (1–60 minutes)
- Cooldown window — Wait time before any subsequent scaling action (default: 5 minutes)
Manual instance scaling
When autoscaling is enabled, manual instance scaling is disabled. Autoscaling manages instance counts within the min/max guardrails you define.
To understand how an application’s instances are distributed, you can view the
instance details in the project’s /run/peers.json file. To learn more, see View application instance details in the “Resource configuration” topic.
Enable Autoscaling
To enable autoscaling, follow the steps below:
- Open your project in the Console
- Select the environment where you want to enable autoscaling
- Choose Configure resources
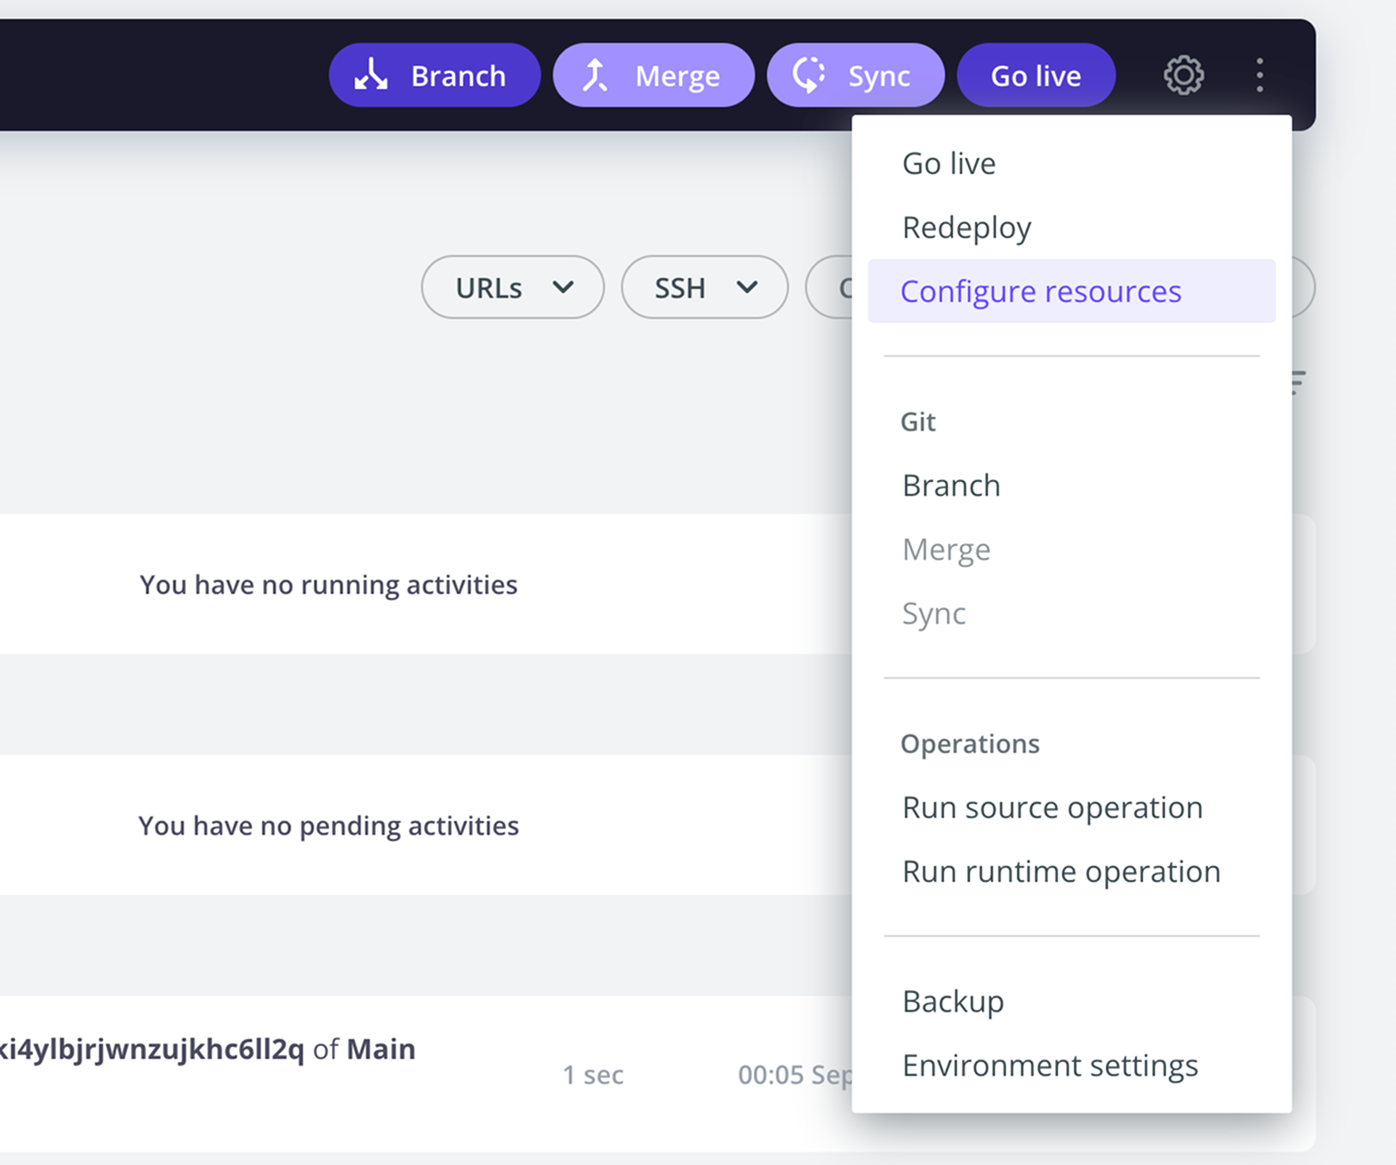
- Under the autoscaling column select Enable
- Configure thresholds, evaluation period, cooldown, and instances as needed
Alerts and metrics
When autoscaling is enabled, the system continuously monitors metrics such as CPU usage, instance count, and request latency. If a defined threshold is crossed, an alert is triggered and the platform automatically responds by adjusting resources.
Scaling activity is visible in several places:
- Metrics dashboards show when scaling has occurred
- Alerts and scaling actions are also visible in the Console:
- Alerts appear with a bell icon (for example - Scaling: CPU for application below 70% for 5 minutes)
- Scaling actions appear with a resources icon (for example, Upscale: 1 instance added to application)
- Alerts and scaling actions are also listed in the CLI as
environment.alertandenvironment.resources.update - To review detailed scaling events, open the Resources dashboard by navigating to {Select project} > {Select environment} > Resources
Configure alerts
You can also configure notifications for alerts.
For example, by setting up an activity script on environment.alert, you can automatically send yourself an email, a Slack message, or another type of custom notification.
Metric resources
If you’re looking to keep track of your infrastructure and application metrics see:
Billing and cost impact
Autoscaling projects are billed for the resources that they consume. Instances added through autoscaling are billed the same as if you were to manually configure those resources.
Added instances are deployed automatically without downtime.
To control costs, avoid overly aggressive settings (e.g. very short evaluation periods).
Metric resources
If you’re looking to keep track of your billing see:
Best practices for autoscaling
Autoscaling gives you flexibility and resilience, but to get the best results it’s important to configure your app and thresholds thoughtfully. Below are some best practices to help you balance performance, stability, and cost.
Cost & stability
- Set thresholds wisely: Configure realistic scale-up and scale-down thresholds to avoid unnecessary deployments.
- Smooth spikes: Use longer evaluation periods (10–15 minutes) if your app traffic spikes often, to prevent rapid up-and-down scaling.
- Control instance counts: Define minimum and maximum instances to manage costs while keeping required availability.
- Monitor costs: Track billing and usage after enabling autoscaling, then adjust thresholds as needed.
Application design
- External services: Use external services such as databases and caches instead of embedding them within the autoscaled applications.
- Keep containers portable: Follow Upsun recommendations for caching and mounts for composable images and single-runtime images.
Cron jobs & long-running tasks
- CPU spikes from jobs: Cron jobs can increase CPU usage and may trigger scale-ups so factor this into your threshold settings.
- Job continuity: Cron jobs remain bound to their starting container and are not interrupted by scaling, so plan instances accordingly.
Supported services and actions
Autoscaling does not currently support queues or background worker services.
Scaling down to zero instances is also not supported. Use minimum instance counts to define your baseline availability.