Fastly CDN
Back to home
On this page
The Fastly CDN integration provides a centralized interface within the Upsun Console to oversee your edge traffic, manage cache, edit access control lists (ACLs), and tune performance without switching platforms. You can also manage dynamic configuration by using Edge Dictionaries.
Install the Fastly CDN plugin 
- Go to https://console.upsun.com/-/add-plugin and click Add plugin.
- Enter the plugin manifest URL https://fastsun.plugins.pltfrm.sh/manifest.json and click Create.
Tip: You can also click here to install directly in the Upsun console.
Manage and monitor your CDN traffic
The Fastly CDN integration provides a centralized interface within the Upsun Console to oversee your edge traffic, manage cache, and tune performance without switching platforms.
Access the Fastly dashboard
-
In the Upsun console, navigate to the project and environment you want to monitor.
Note: To view summarized monthly project-level traffic, including CDN bandwidth and CDN requests, see the Traffic this month section of a project page (make sure no environment is selected).
-
On the Fastly CDN tab, log in with your Fastly credentials (Service ID and API token).
-
If you have a Fastly subscription, you can retrieve your credentials directly from the Fastly interface.
-
If you purchased Fastly through Upsun, you can retrieve your credentials by running
upsun ssh "printenv | grep FASTLY"in your terminal, or by opening a support ticket.
Your Fastly credentials are stored securely within your browser and are never transmitted to Upsun.
-
Track real-time and historical performance
The dashboard provides two levels of visibility into how your site is performing at the edge:
-
Real-time metrics: Monitor current traffic spikes, request rates, and global delivery status as it happens.
-
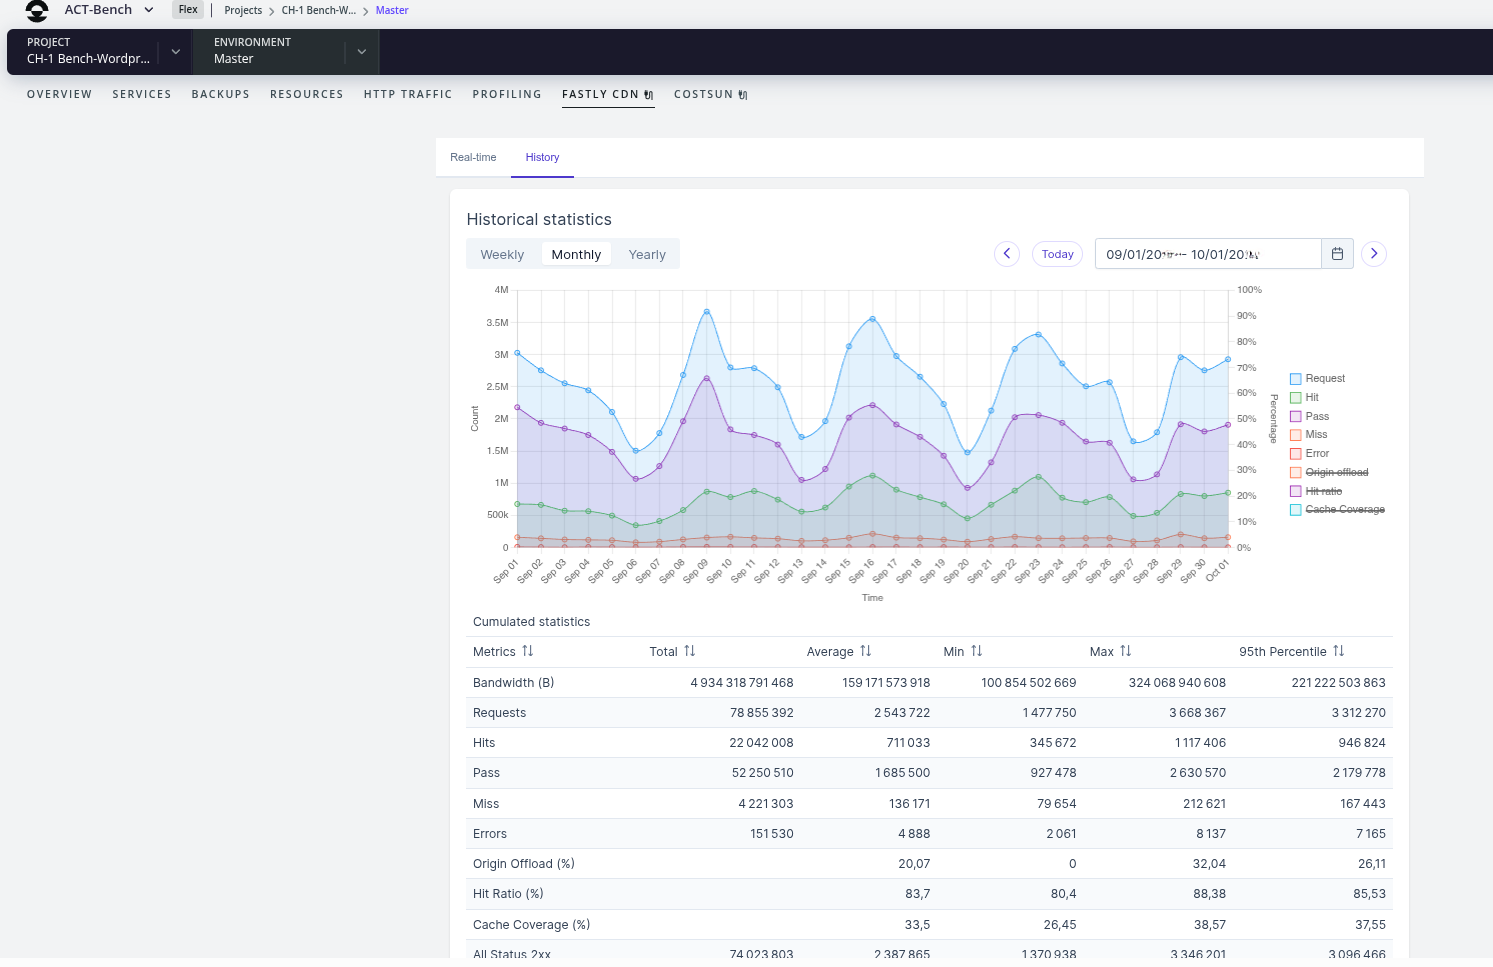
Historical metrics: Use the date picker to analyze trends over weeks or months. You can toggle specific metrics on the graph to isolate data like cache hit ratios, 4xx/5xx error rates, and total bandwidth.
The image below shows a sample historical metrics tab for a selected environment:
Manage dynamic configuration with Edge Dictionaries
Edge Dictionaries allow you to store key-value pairs at the CDN level to control site behavior in real-time. This integration enables you to update configurations (such as feature flags, redirects, or header values) instantly, without a full code redeploy or VCL version change. This can be helpful, for example, to block a bot attack or quickly update a site banner.
With this integration, you can:
- Update instantly: Add, edit, or delete items via the UI or API for immediate effect.
- Secure secrets: Use write-only dictionaries to store sensitive API keys that are accessible to your logic but hidden from view.
- Maintain consistency: Leverage built-in validation and a management workflow that mirrors Fastly ACLs.
Example: Use a Dictionary for a maintenance toggle
Instead of hard-coding a maintenance mode in your application, you can use an Edge Dictionary (for example, named site_config) to toggle a “Maintenance Mode” page at the edge.
-
Define the dictionary: Create a dictionary named
site_configand add amaintenance_enabledkey with a value oftrueorfalse. -
Add the VCL Logic: Add the following snippet to your Fastly configuration to check the dictionary value on every request:
sub vcl_recv {
  # Check if the 'maintenance_enabled' key is set to 'true' in the dictionary
  if (table.lookup(site_config, "maintenance_enabled") == "true") {
    # Send a 503 Service Unavailable response immediately
    error 601 "Maintenance";
  }
}

sub vcl_error {
  if (obj.status == 601) {
    set obj.status = 503;
    set obj.response = "Service Unavailable";
    synthetic {"
      <html>
        <body>
          <h1>We'll be back soon!</h1>
          <p>Our site is currently undergoing scheduled maintenance.</p>
        </body>
      </html>
    "};
    return(deliver);
  }
}
Related information:
- How to create a custom maintenance page in Fastly - this Upsun Dev Center article also describes how to create a Fastly configuration.
- Fastly Next-Gen Web Application Firewall (WAF)