Understand Upsun metrics
Back to home
On this page
Upsun environments consist of:
- App containers: one or more app containers
- Service containers: zero or more service containers
- Worker containers: zero or more worker instances.
Infrastructure metrics report CPU, RAM, and disk space for app, service, and worker containers. These metrics are available for all of your environments.
App containers are shown first, with the app name and an image corresponding to the app type. Service containers follow next with the same pattern, and worker containers are shown last.
You can collapse the graphs by clicking the 3-dot menu on the right-hand side, then Hide resources. The graphs switch to an overview of the average resource utilization for the selected container.
The same menu provides a convenient Configure resource CTA, allowing you to swiftly adjust resources allocation for that container based on the observability metrics.
Example of how to read metrics 
This example should give you an idea of how the metrics appear. Environment metrics show resource usage for each app, service, and worker container.
This reference project has a single app, two services (MySQL and Redis), and two workers. The appropriate resources have been manually allocated for each container. The graphs show the current average usage in relation to the resources allocated to each container.
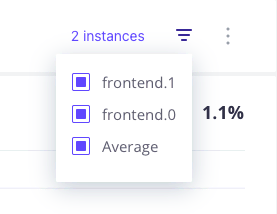
By default, the graphs include all instances and an average over the instances. To select metrics for specific instances, click Filter.
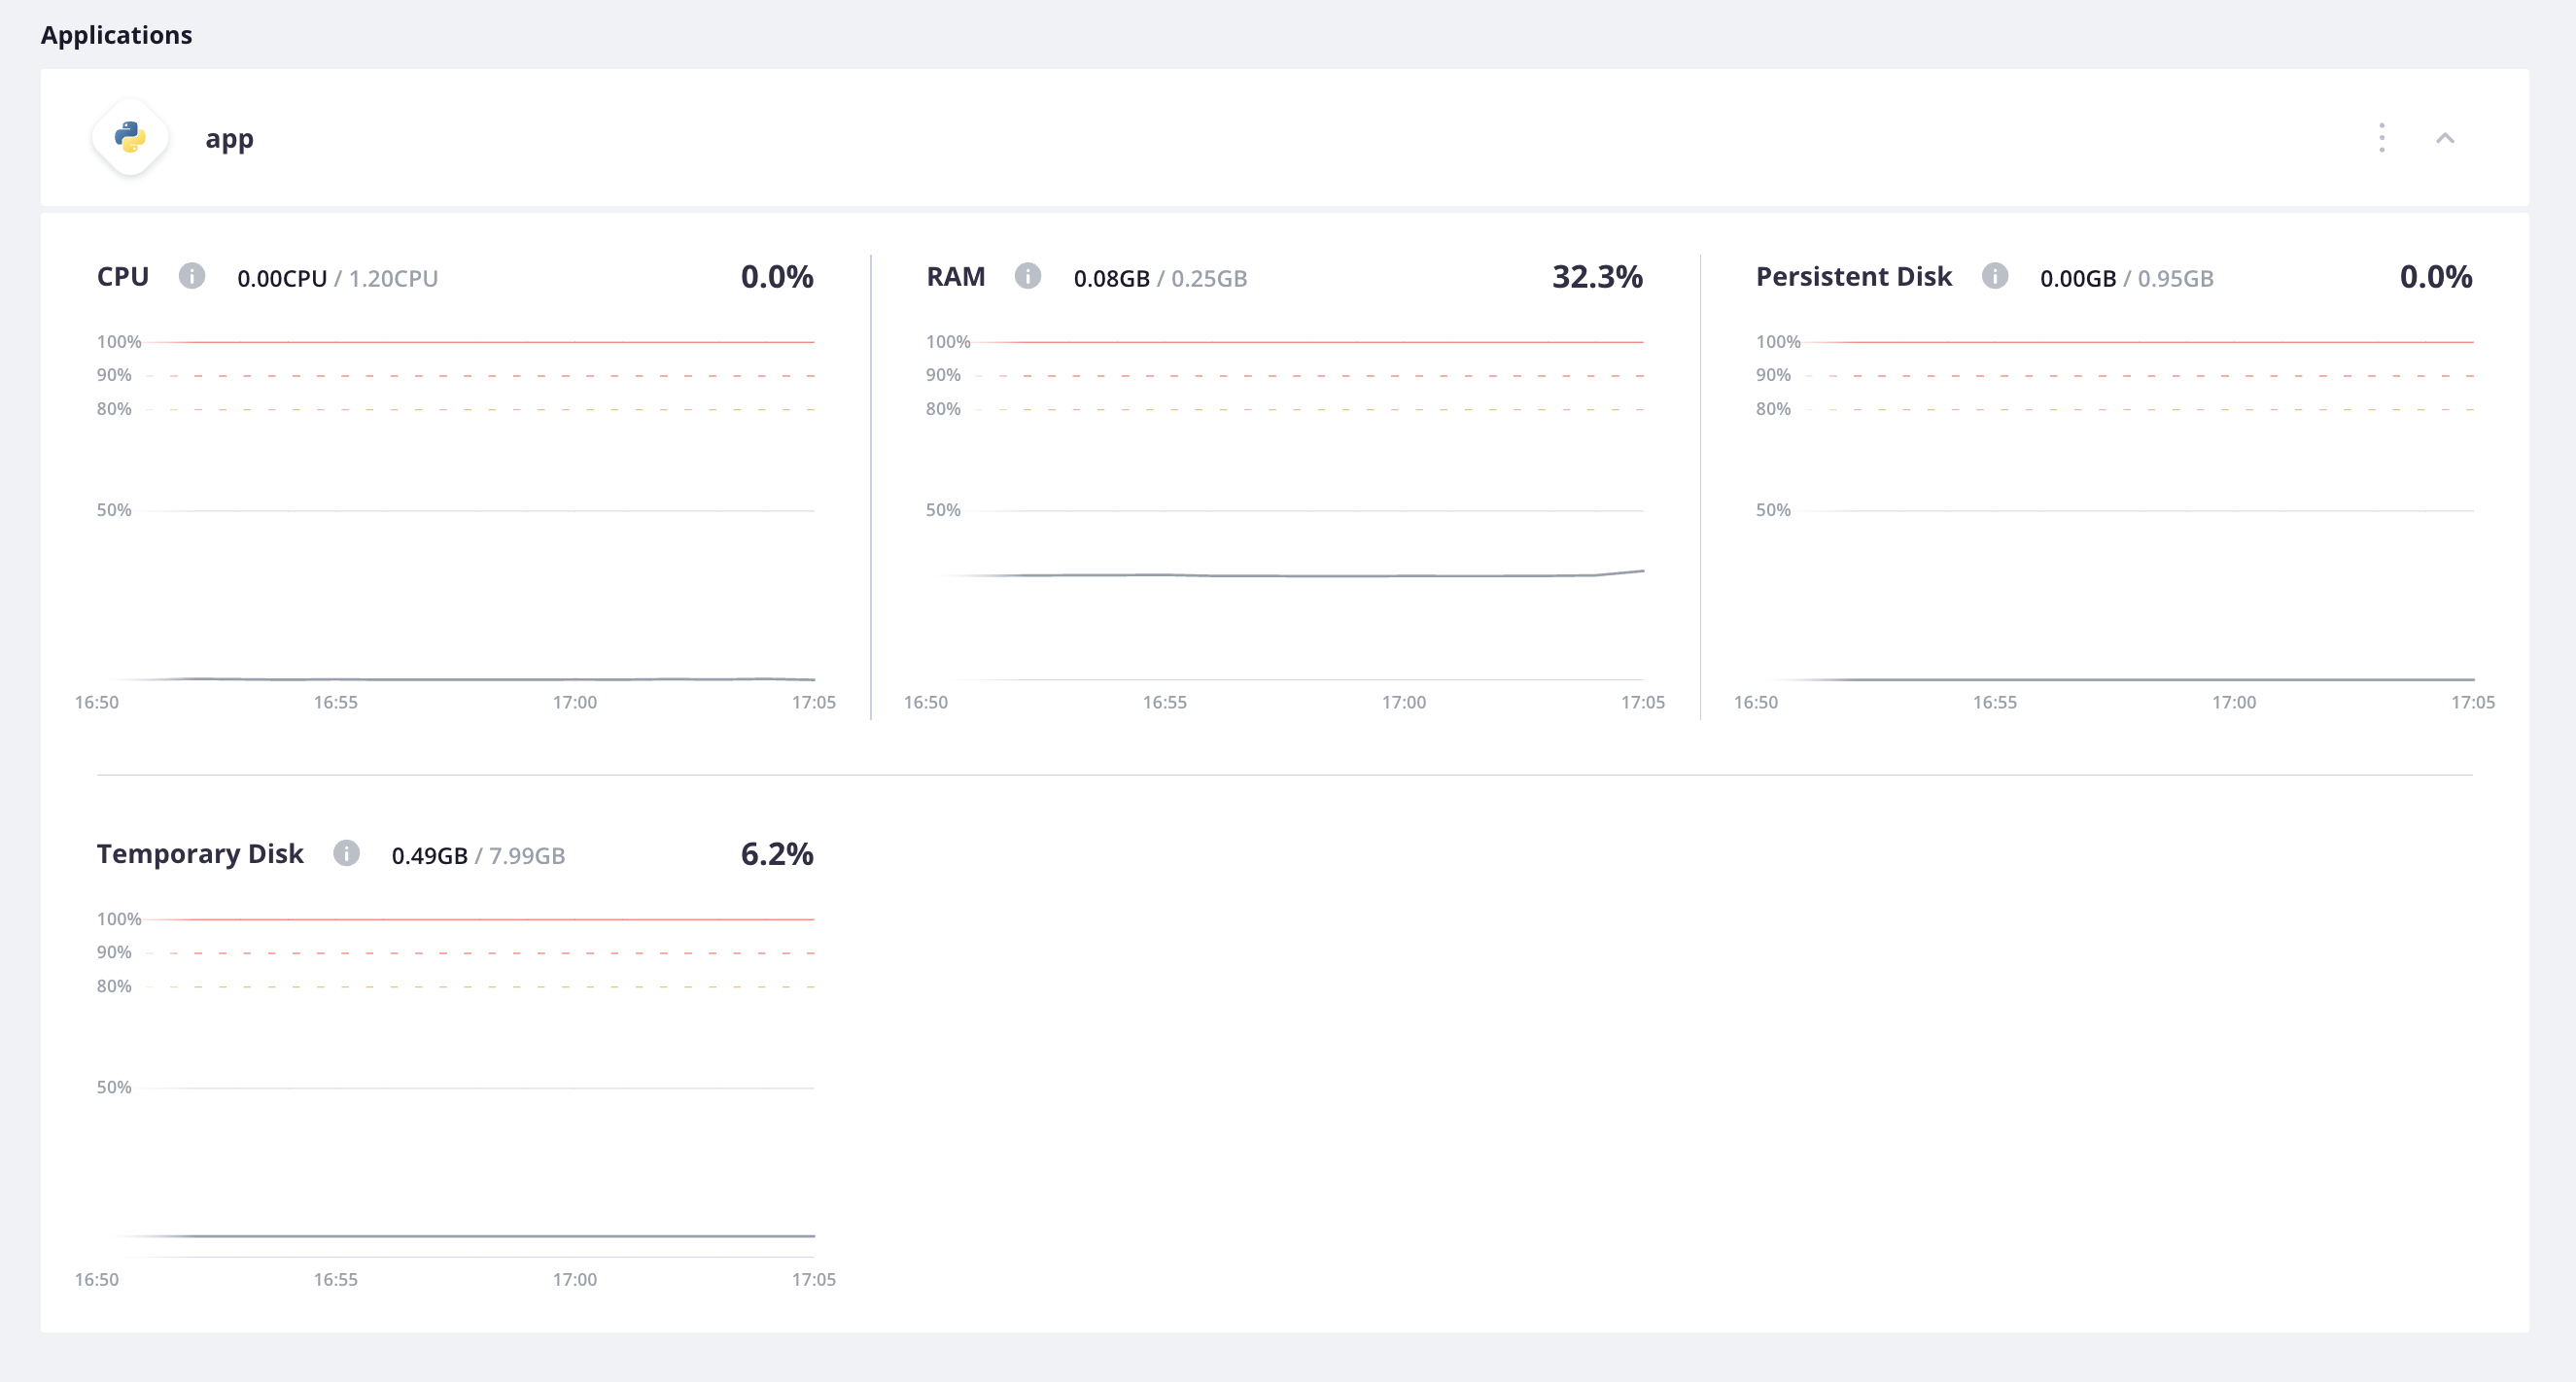
App container
Metrics graphs for the app container show CPU, RAM, and disk allocation and usage. The persistent disk has been configured in the project resources.
Service containers
Metrics graphs for the service containers show CPU, RAM, and disk allocation and usage.
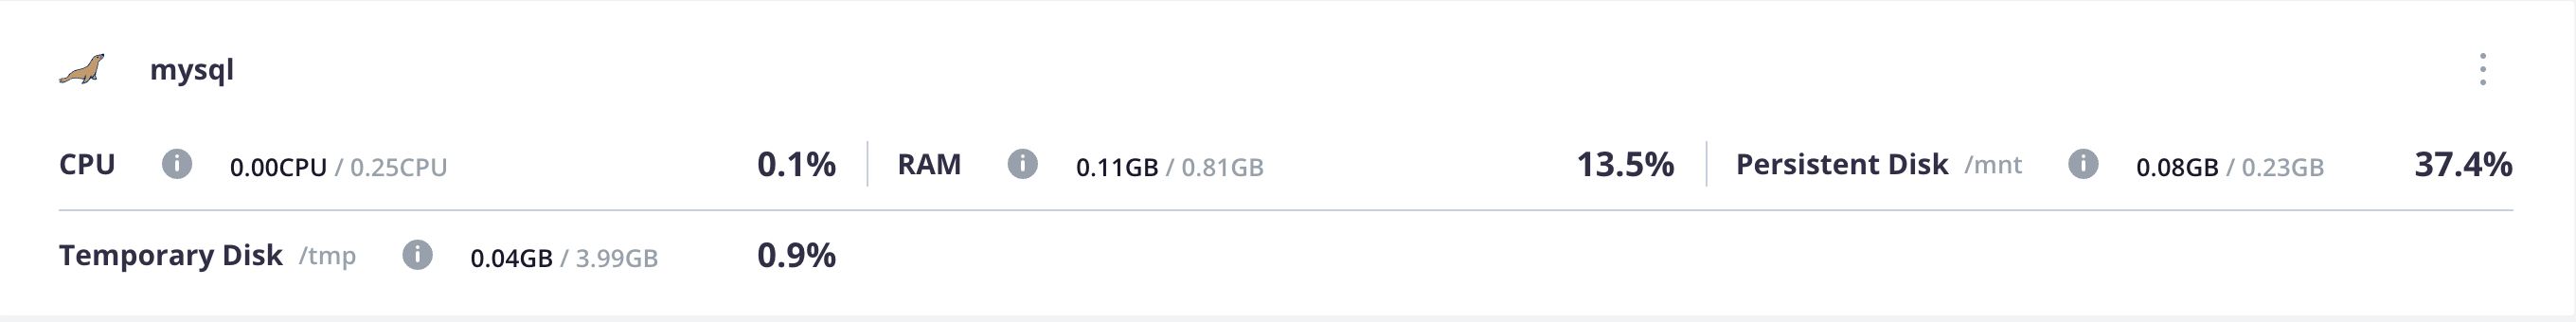
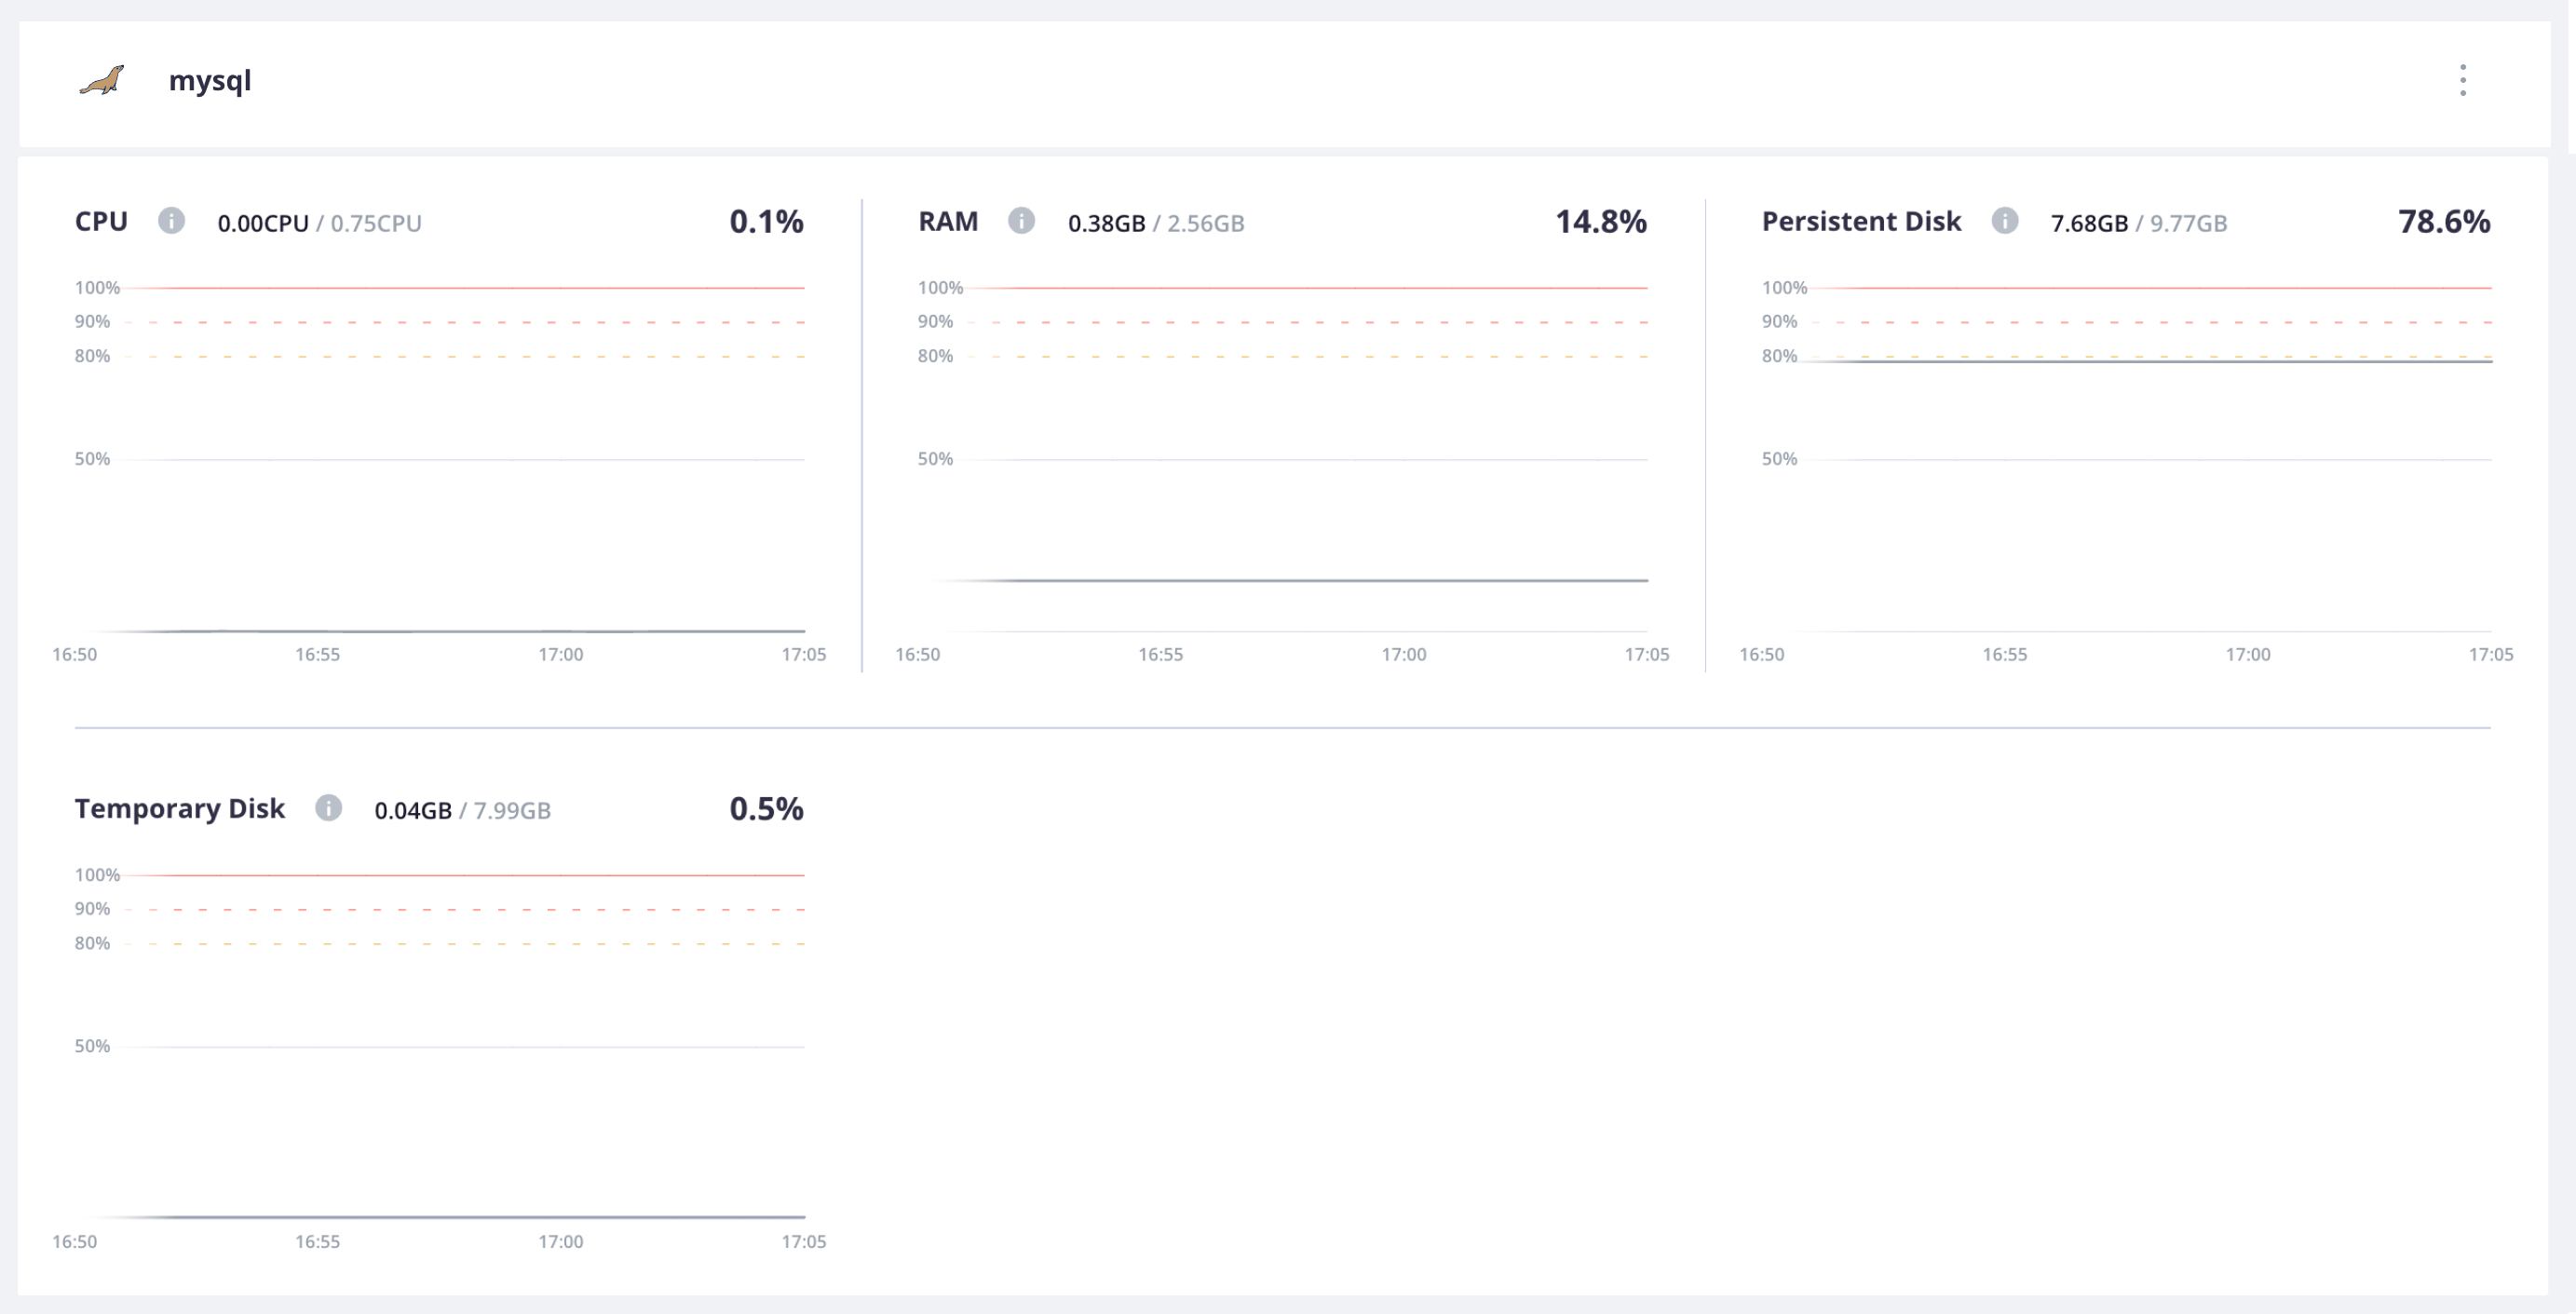
MySQL
Metrics graphs for the MySQL service container show CPU, RAM, and disk allocation and usage. The persistent disk has been configured in the project resources.
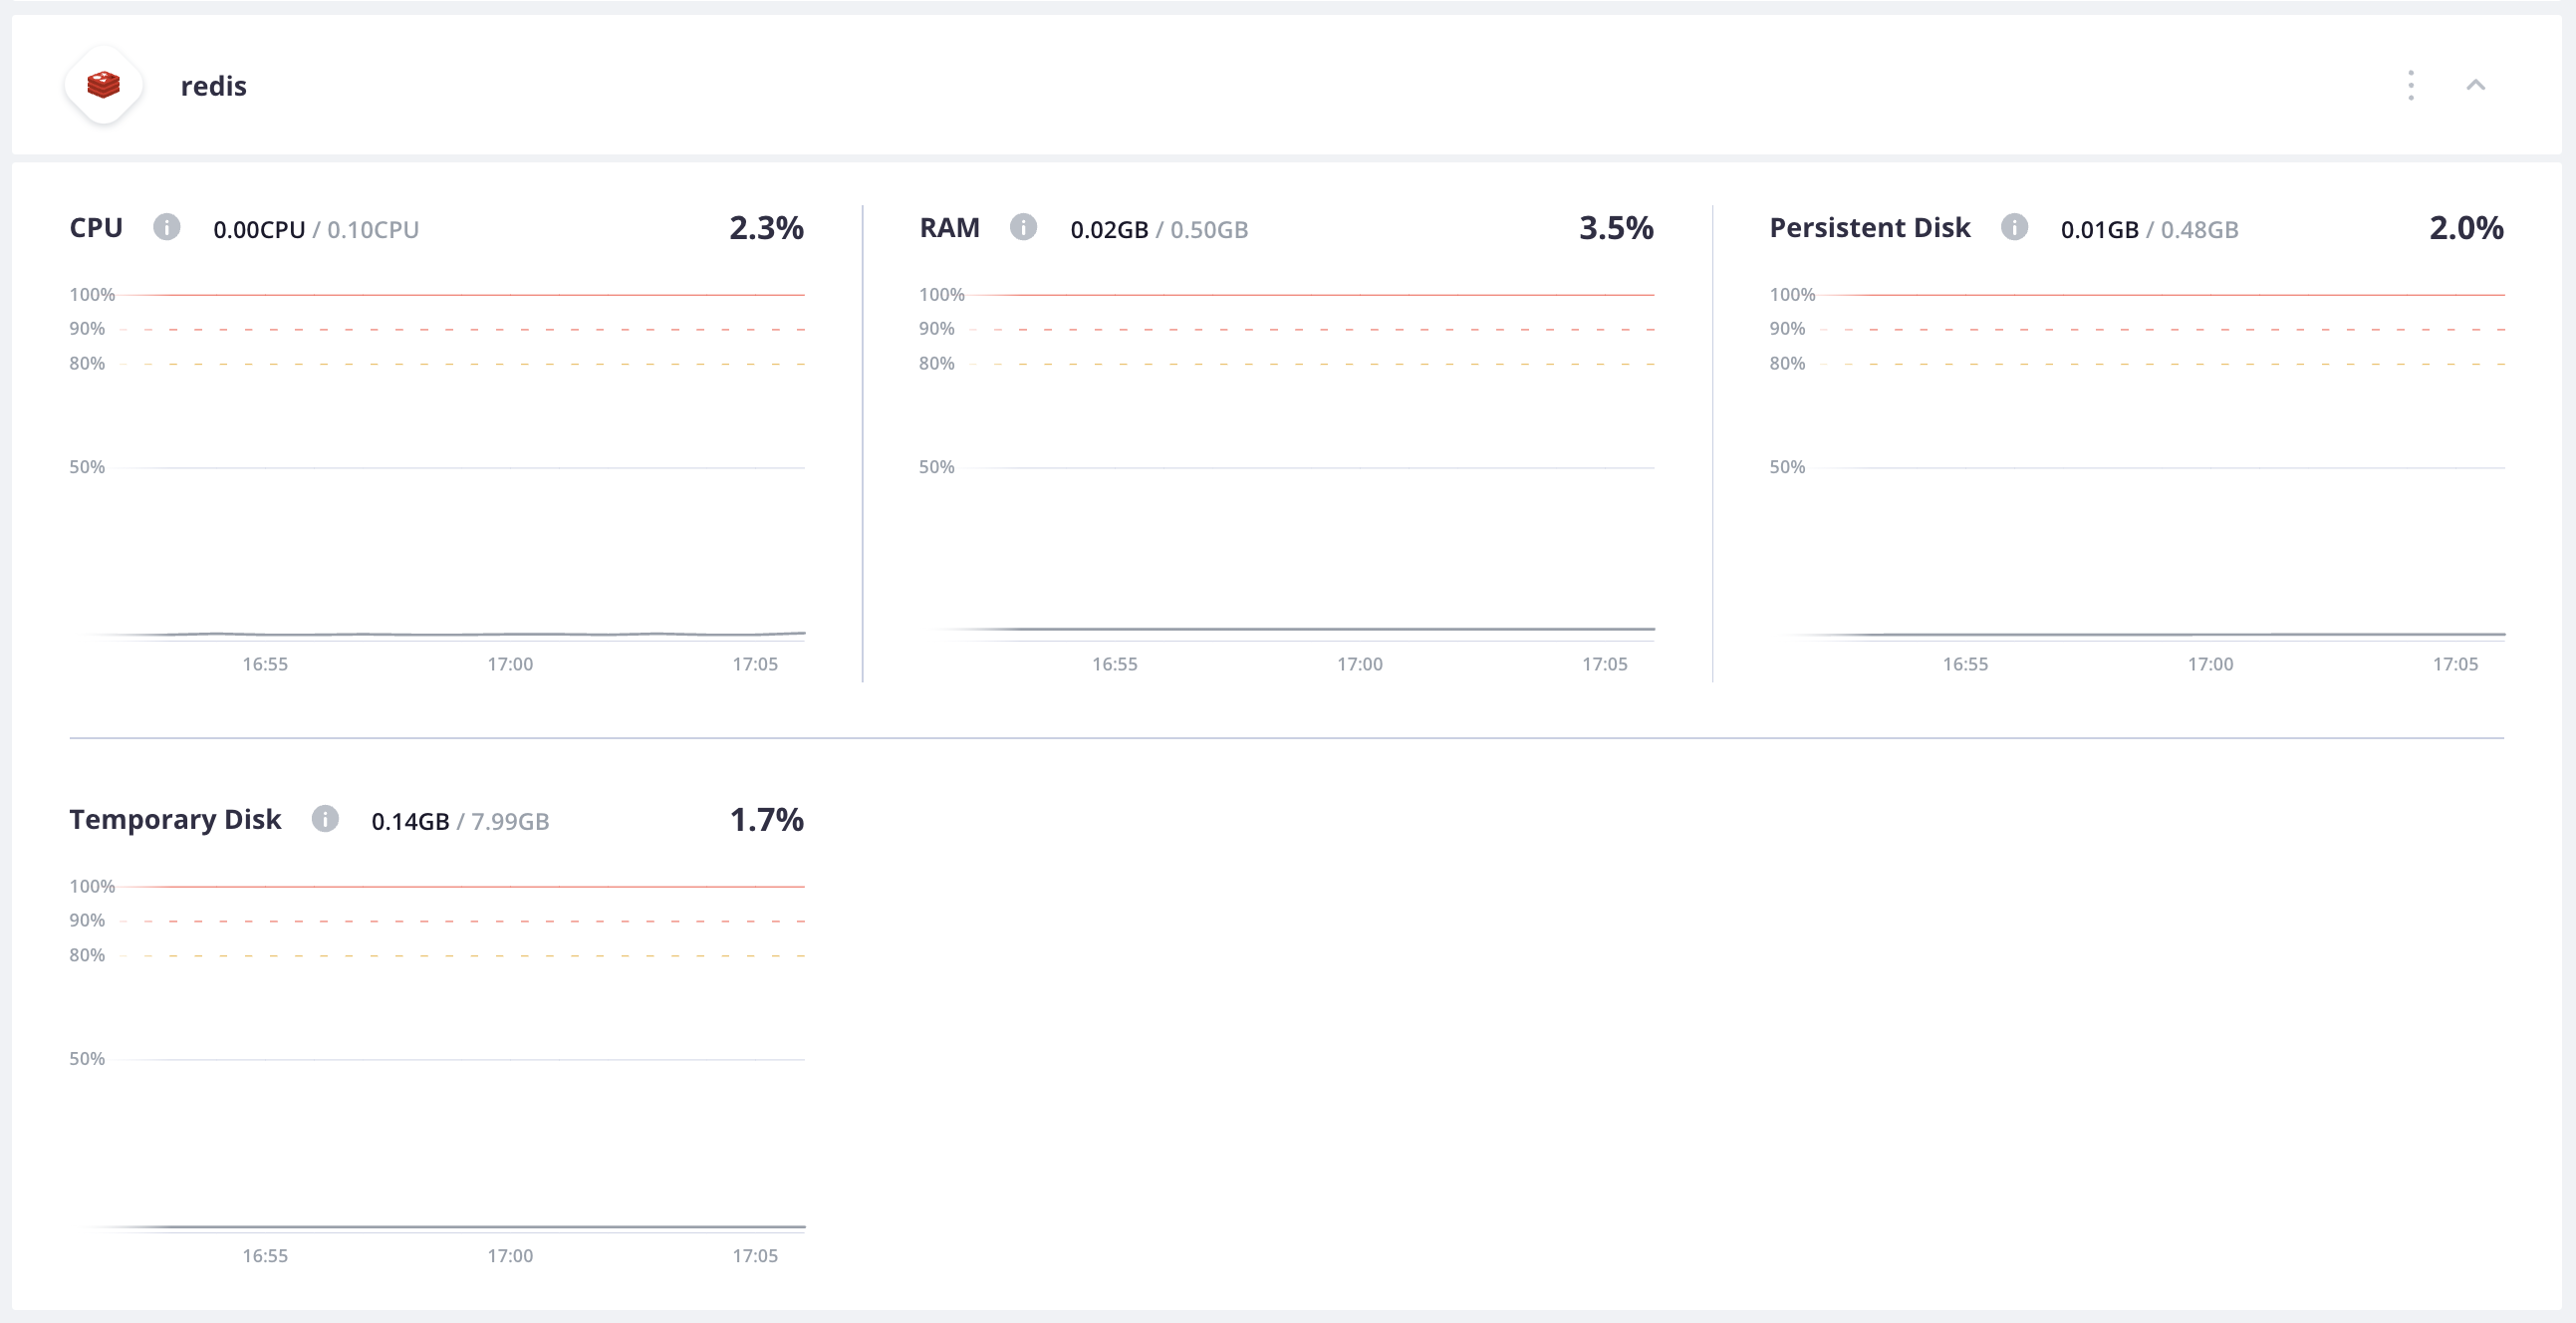
Redis
Metrics graphs for the Redis service container show CPU, RAM, disk allocation and usage. No persistent disk has been configured for Redis.
Worker containers
Metrics graphs for the App-Horizon worker container show CPU, RAM, and disk allocation and usage. The persistent disk has been configured in the project resources.
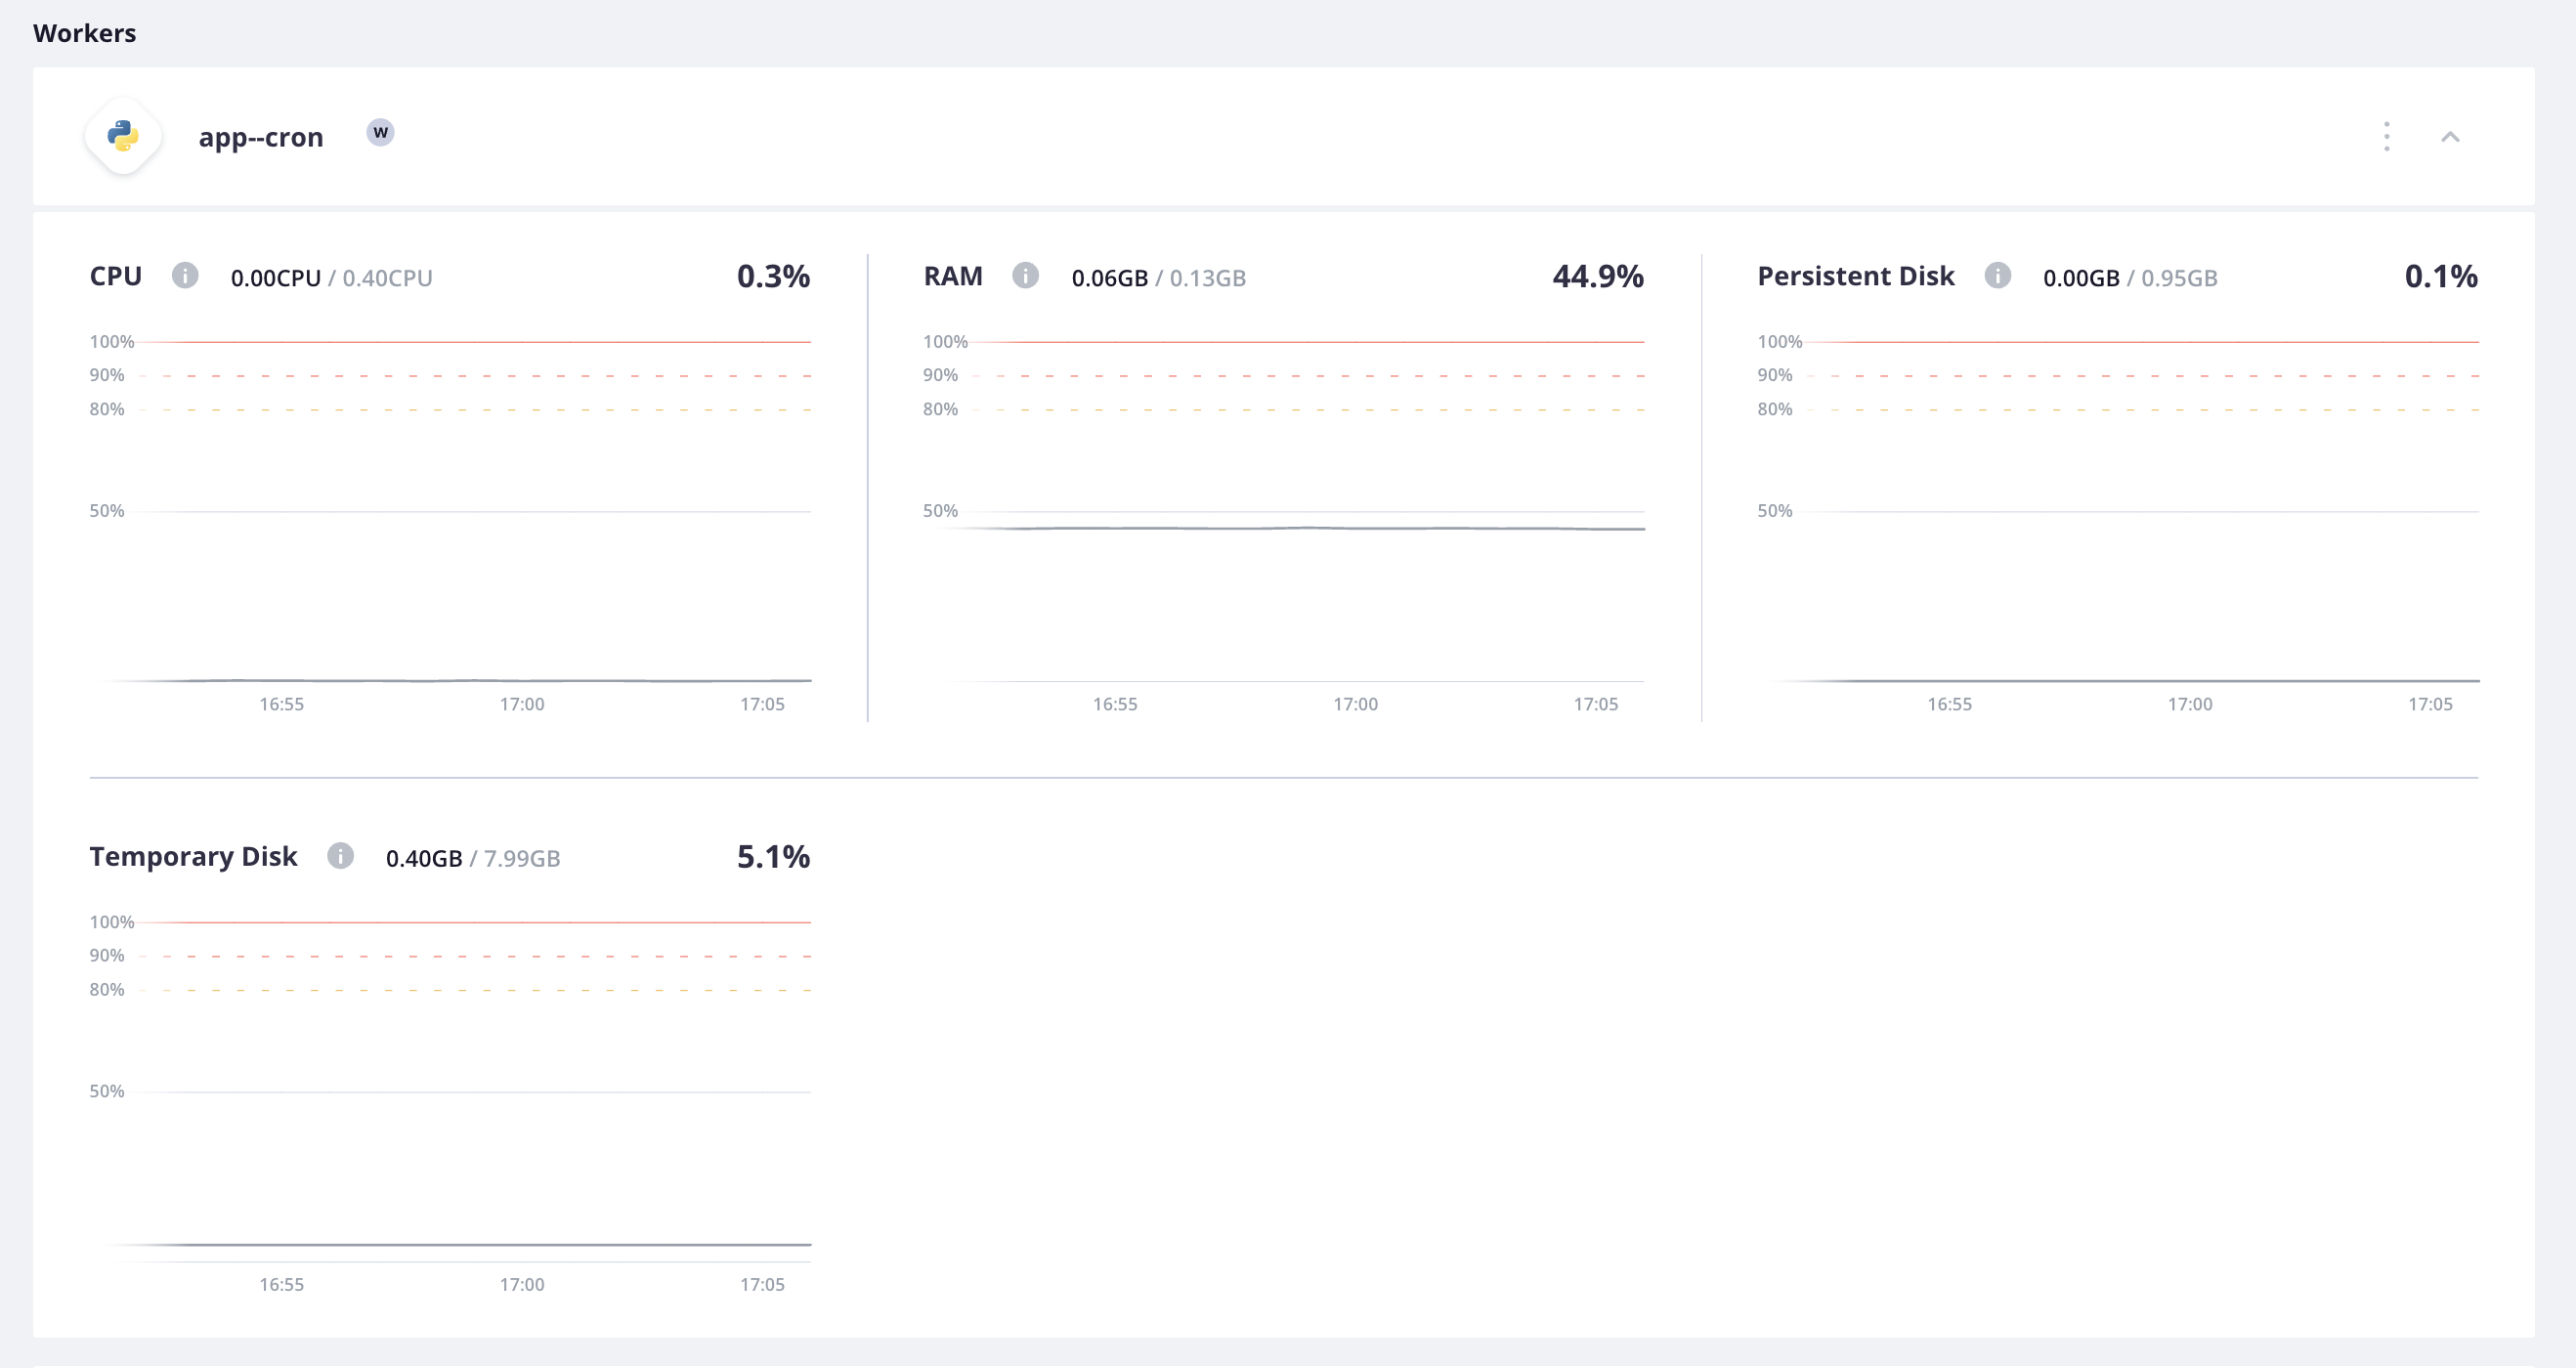
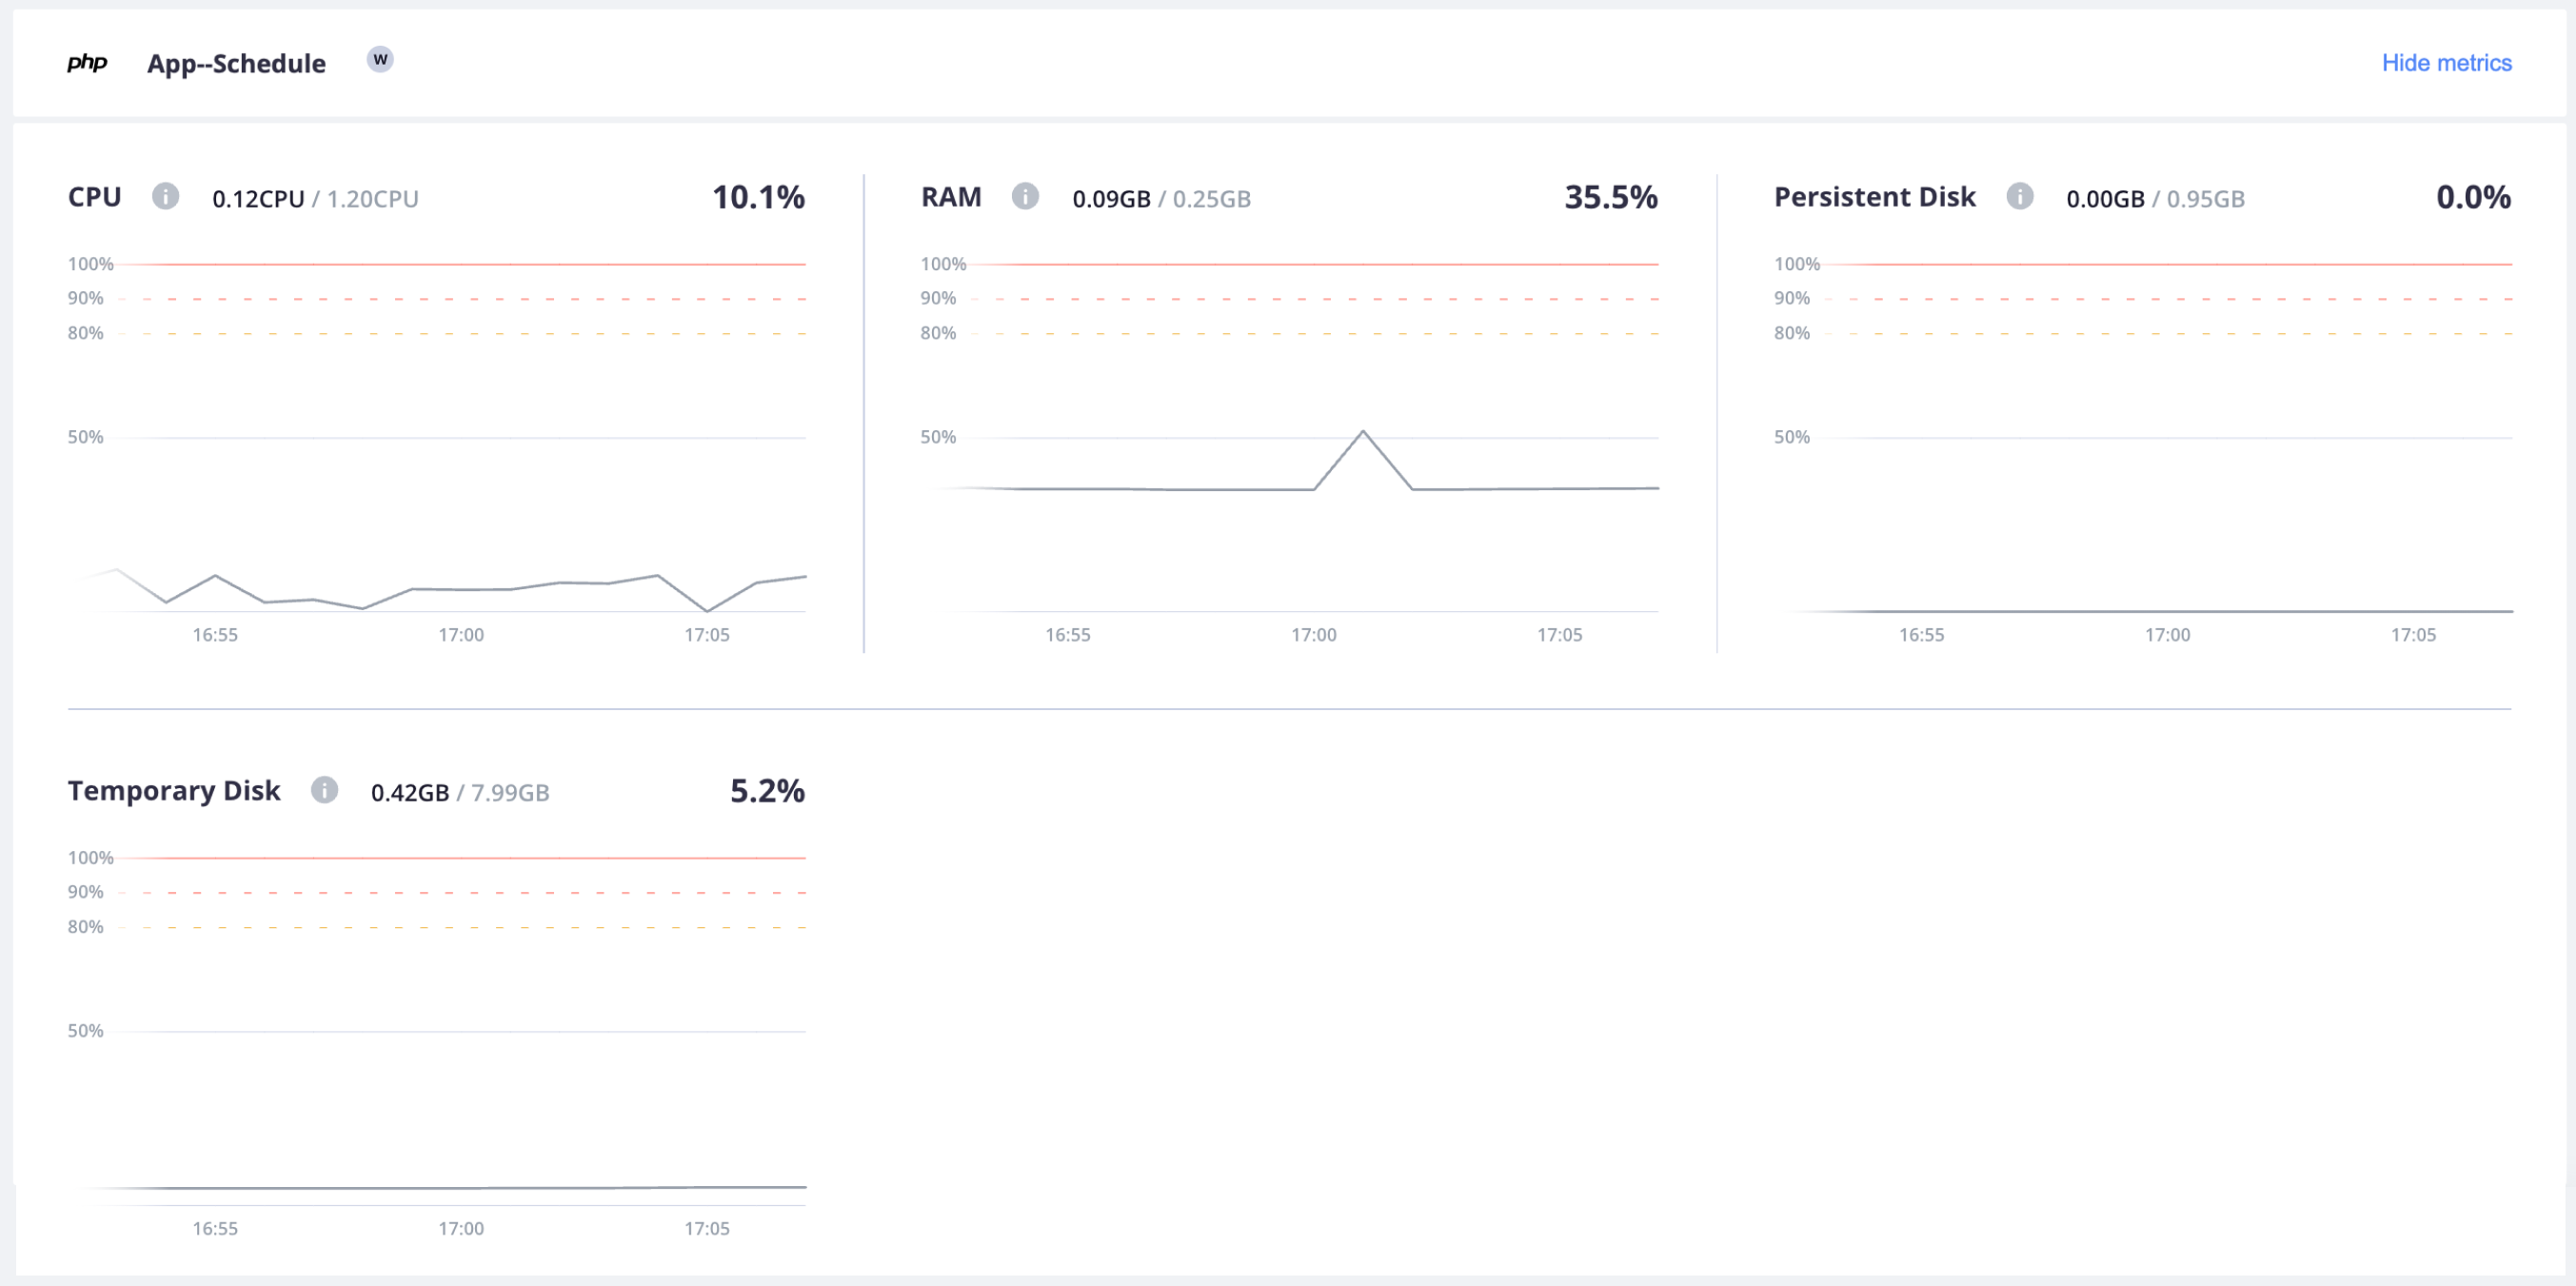
Metrics graphs for the App-Schedule worker container show CPU, RAM, and disk allocation and usage.
The persistent disk has been configured in the project resources.